Return to OrthoViewer Main Menu…..
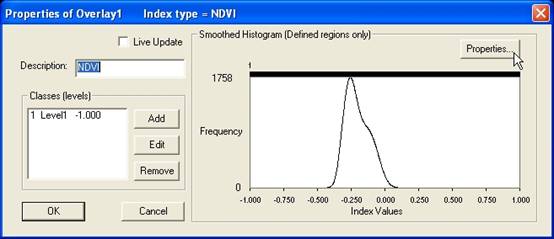
5. The image classification process relies on the histogram of the vegetation index values as a basis for defining divisions between index classes:

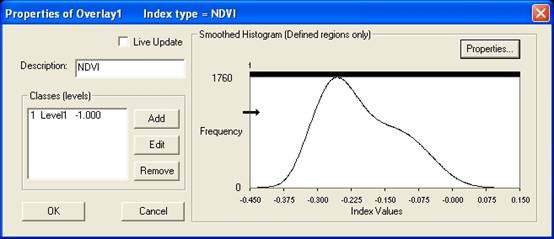
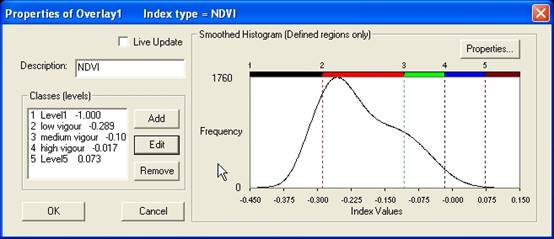
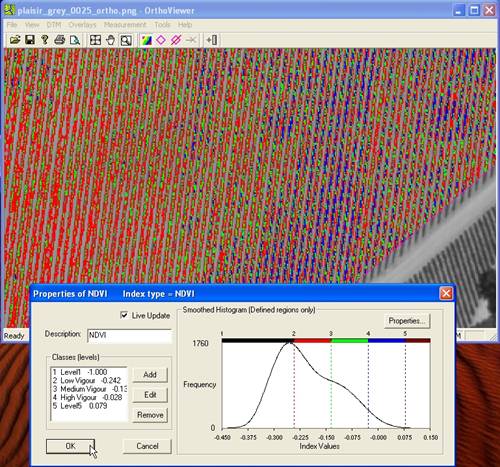
In our example we are working with an NDVI classification and you can change the [Description] from “Overlay1” to “NDVI” as shown in the example below:

Vegetation indices have a relatively large possible range of values, of which only a small section is active for a typical vineyard scene. This can be seen in the rather narrow histogram seen in the picture above. In order to allow for better ease of use, it is recommended that minimum and maximum index values that are displayed are modified to reflect the histogram distribution observed for the specific area under investigation. This is done with the [Properties] pop-up screen which is activated by pressing the [Properties] button:
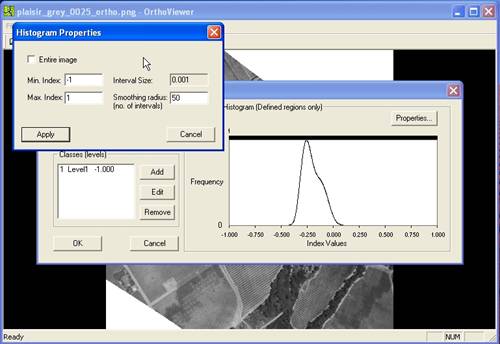
The minimum and maximum index values chosen from the displayed histogram can then be entered into the [Min. Index] and [Max. Index] text boxes. In this example values of -0.45 and 0.15 were chosen:
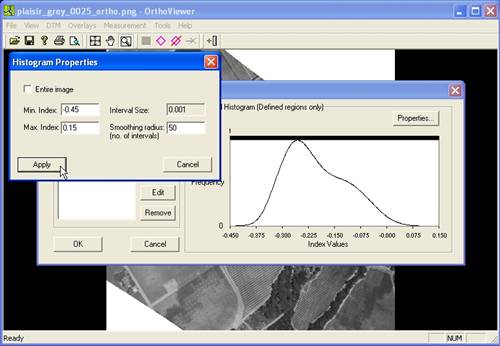
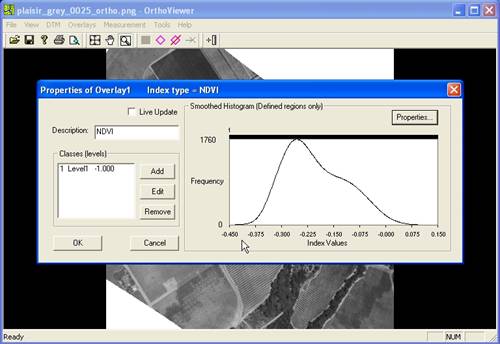
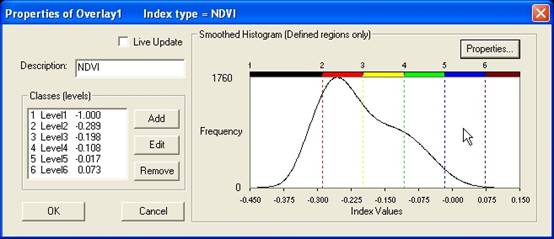
Once the new minimum and maximum index values have been chosen, press the [Apply] button to reveal an easier to use histogram display:
In order to add index classes hold down the left-hand-mouse-button over the edge of the histogram window, as shown below. The mouse button will then be shown as a horizontal arrow:
You can then drag-and-drop as many index classes as desired into the histogram window:
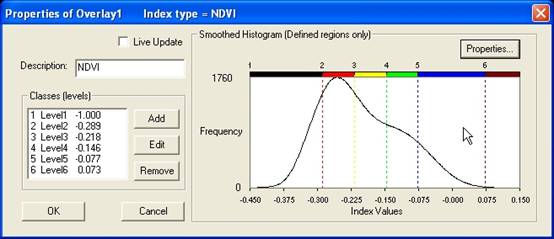
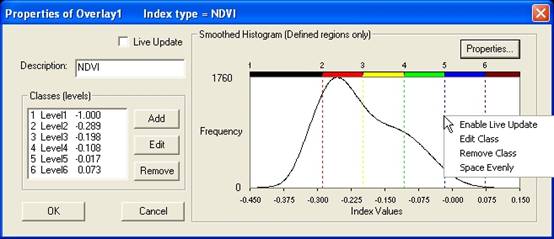
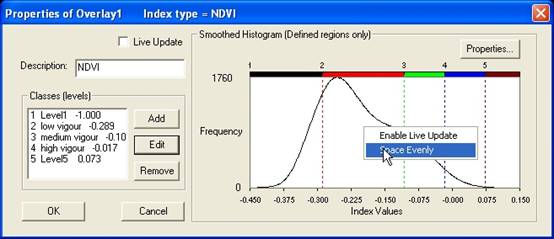
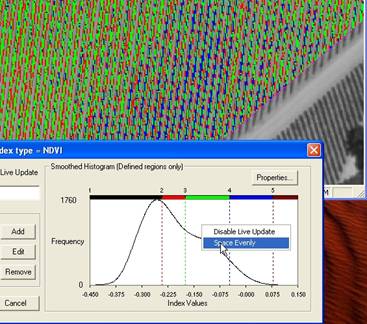
Once all of the desired index classes have been defined, you need to get the distribution of the classes sorted out for the vineyard block under investigation. This is a matter of much discussion, but a good start point is to setup an equal distribution between all of the classes. This can be done by pressing the right-hand-mouse-button in the histogram window:
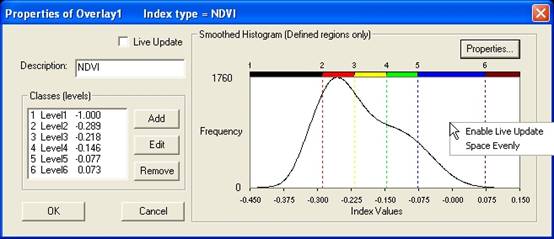
Choose the [Space Evenly] menu option to achieve the desired result:
Class properties can be modified at any stage while in the “Properties of Overlay#” pop-up window. This can be done in two ways. The first method is to press the right-hand-mouse-button while the mouse cursor is over the line defining the class boundary in the histogram window. This brings up a pop-up window as seen in the image below:
Choosing the [Edit Class] menu option brings up “Edit Overlay Class” pop-up window:
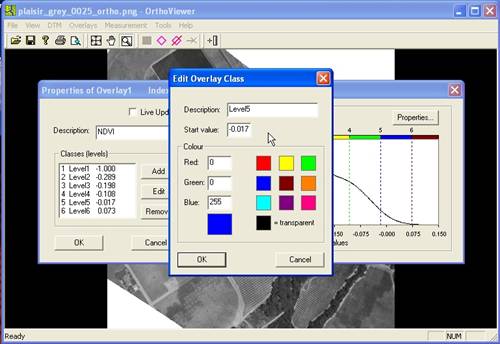
You can now change any of the class properties (description, index level and colour). The second method to edit a class is to select the class to be edited in the “Classes (levels)” window and then press the [Edit] button:
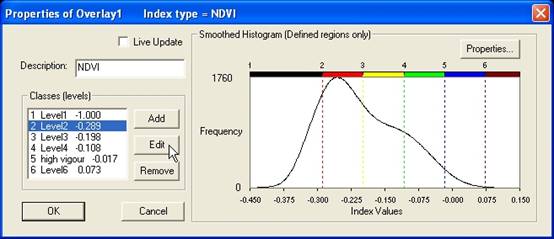
Similarly, if you wish to delete a class, this can be done using the [Remove Class] menu item from the pop-up window when pressing the right-hand-mouse-button over the class defining line, or the [Remove] button once the class has been highlighted in the “Classes (levels)” window, as described above. The result of removing level2 from the example is seen below. Please note that the remaining classes have been renamed to provide a better description:
Having removed a class, it is recommended to repeat the [Space Evenly] process described above:
In order to see the results of the classification scheme, you need to tick the [Live Update] check box:
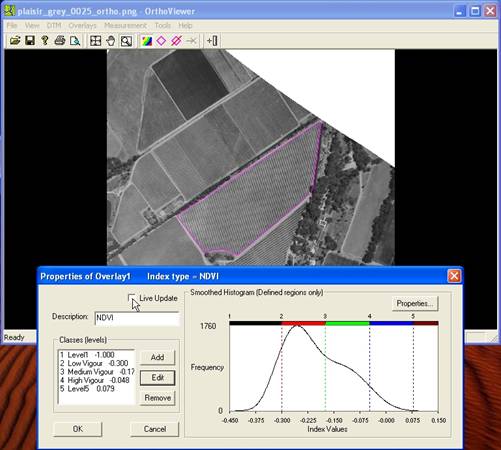
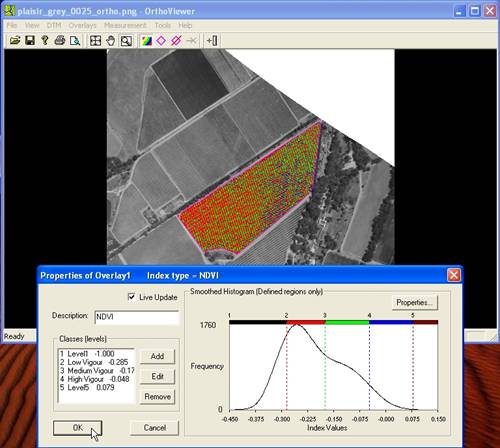
The “background” image will now have the classified index colours displayed:

Once satisfied with the classification scheme, press the [OK] button:
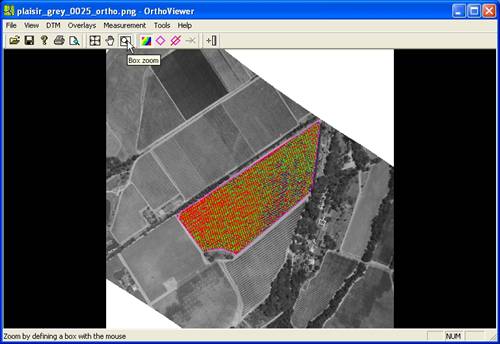
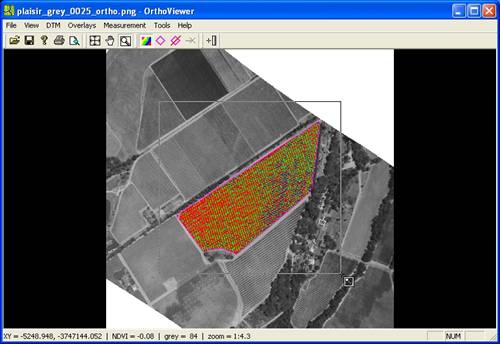
To view more detail and allow for more accurate index classification, there are convenient zoom and pan tools provided. For example the [Box Zoom] button:
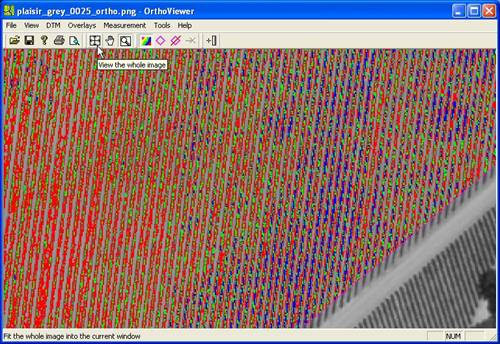
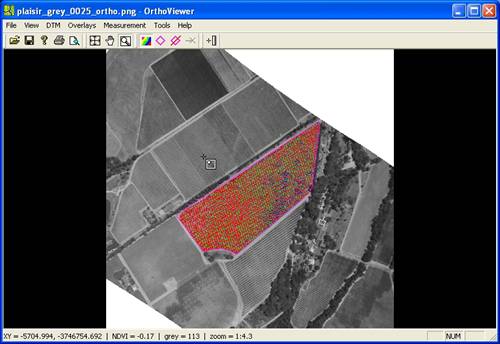
There is also a [View the whole image] button for quick zooming out:
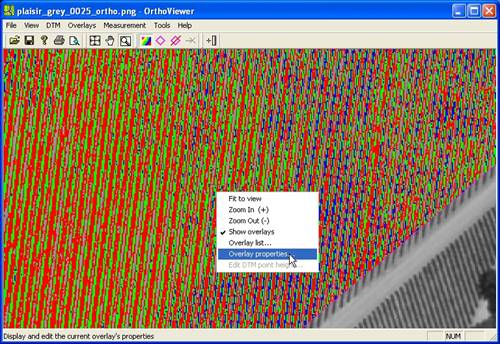
You can, at any stage, return to the overlay properties, using two methods. Through the [Overlays][Properties] menu item, or by pressing the right-hand-mouse-button in the image window:
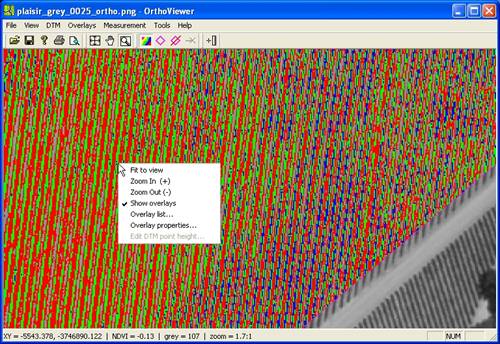
You then need to select the [Overlay properties….] menu item:
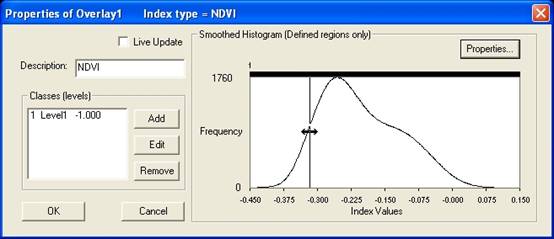
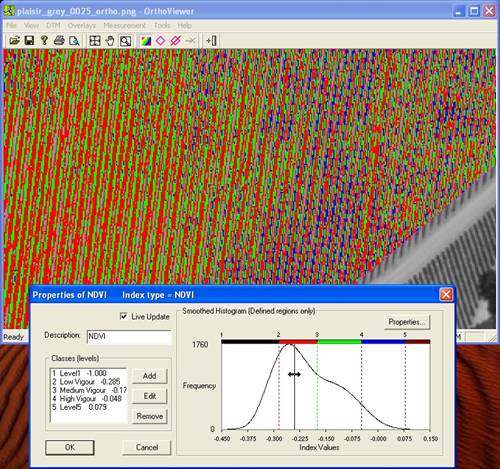
Once back in the “Properties of …….” pop-up window, you can now refine the classification scheme. The typical goal here is to remove the effect of inter-row cover crop from the classification scheme. This is easily done by shifting the class boundary of the “Level1” class. In the histogram window when you press the left-hand-mouse-button when the mouse cursor is over the class boundary to be shifted, the cursor changes to a double-sided arrow. You can now drag-and-drop the class index to a new value:
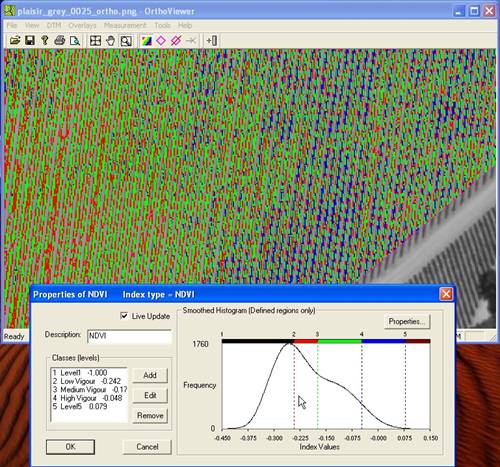
Once you are happy that the effect of the cover crop has been removed, it is recommended that you repeat the [Space Evenly] process:

When you are happy with the classification scheme, press the [OK] button to return to the main program window:
Return to OrthoViewer Main Menu…..